
I think that Age of Empires II is probably the game I’ve been playing on or off for the longest amount of time. In fact, it is this game which pushed me to write a custom tool to prevent DirectDraw palette issues more than eight years ago, before custom community patches (and the “HD version” of the game was available).
I have fond childhood memories of the game, and although I don’t commonly find the time or focus anymore to play it myself, it’s fun to see how the game has found a new community and attention anno 2018, driven by streamers on Twitch such as Nili, T90Official, and MembTv, as well as YouTube personalities such as Spirit of the Law and ZeroEmpires, driving new players to the game. As such, the AOE2 e-sports scene is relatively healthy today, and whereas the game is by no means as popular as e.g. Dota or League of Legends, it’s by far one of the most enjoyable traditional RTS’ games to watch these days, with big tournaments appearing every so often between high-ranking players, with Battle of Africa being one of the more recent ones.
It is important to note, however, that most of this newfound attention does not take place on the Steam version of the game, which is solid enough but is widely regarded as not being the most optimal way to play the game competitively online, with the version being relatively prone to lag, desyncs, and without solid spectator plugins that would allow streamers to display statistics and overlays whilst watching games. Instead, serious players will opt to utilize Voobly, a multiplayer platform and social network which supports a bunch of older games, though AOEII is by far the most popular one, even to a degree that it’s the main focus game for Voobly today. The additional benefits the platform offers go quite far, including proper ELO rankings for players, support to install additional mods and patches for the game, including the incredible community built UserPatch, which extends the game with lots of balancing fixes, bug fixes, and additional features. Together with WololoKingdoms, another community project, one can even bring in the AOE2 HD expansion packs (if you own them, of course) to Voobly.
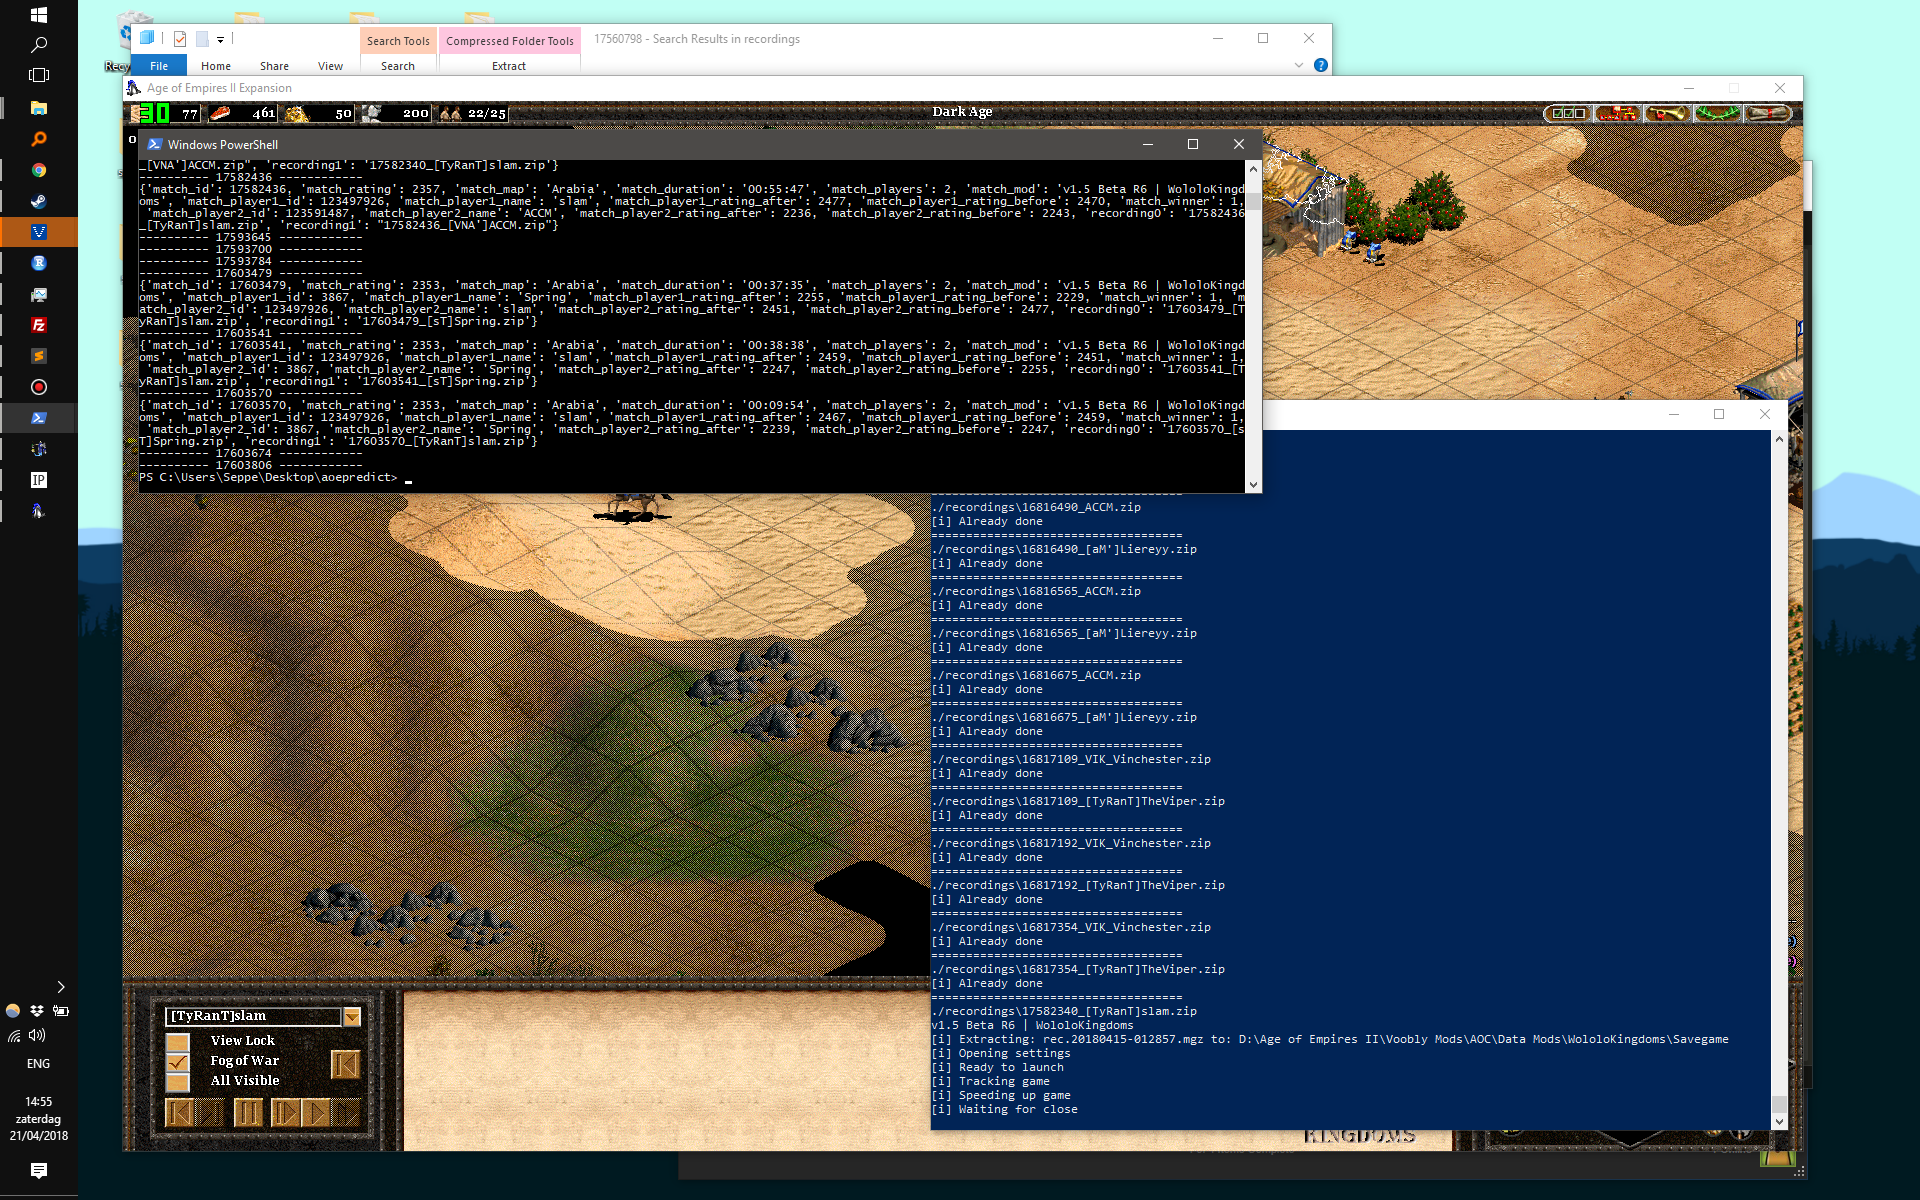
With this background knowledge in mind, and after having spend various Saturday evenings watching tournaments live, I was wondering whether it would be feasible to set up a predictive model that would be able to predict who’d win a match up. During matches, viewers will happily chat away about who they think is winning incorporating things such as number of units, resources available, who advances through research and ages quicker, map control, kill/death ratio, civilizations chosen by the players, the players respective ranking and history, and the score per player the game provides (which is calculated based on various inputs and generally goes up for both as the game progresses):
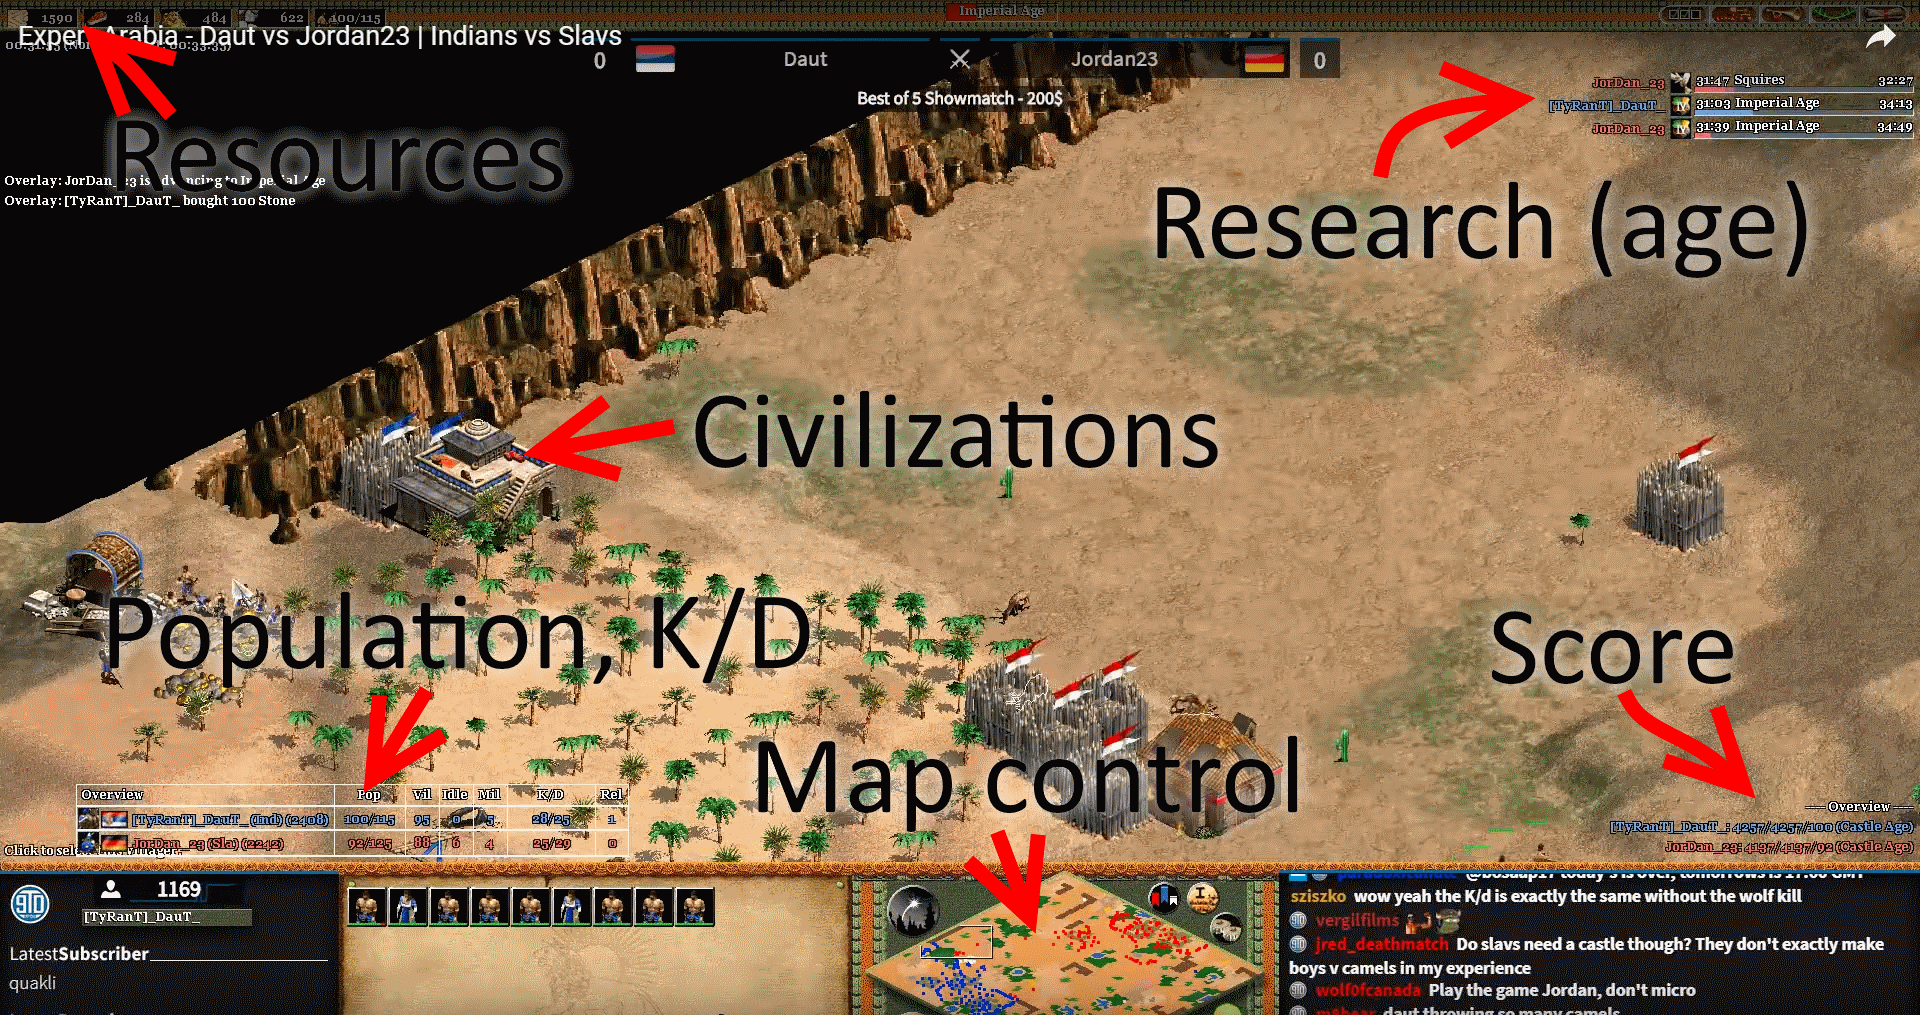
Hence the reason why broadcasters prefer to overlay the screen with additional statistics as provided by Voobly plugins, as the screenshot above shows. Although the community (and pro-players especially) are very good at “feeling” whether they have the upper hand, I wanted to see if this could be quantified a bit more in terms of a predictive model, as well as figuring out how long an average game needs to run before such model would be sure about the outcome. In the final five to ten minutes, it’s often clear who’s going to win a match, but perhaps we could do better than this as well?
And so, an idea for a fun weekend data science project was born.
Gathering the Data
In 90% of all data science projects, gathering and preparing data takes 90% of the time spend on the project, and I didn’t expect it to be much different with this particular one.
A benefit of the Voobly platform is that it keeps a permanent record of all matches that have been played, including statistics regarding the type of map being played, civilizations chosen, who won the game, and a post-game overview of scores and other stats per player:
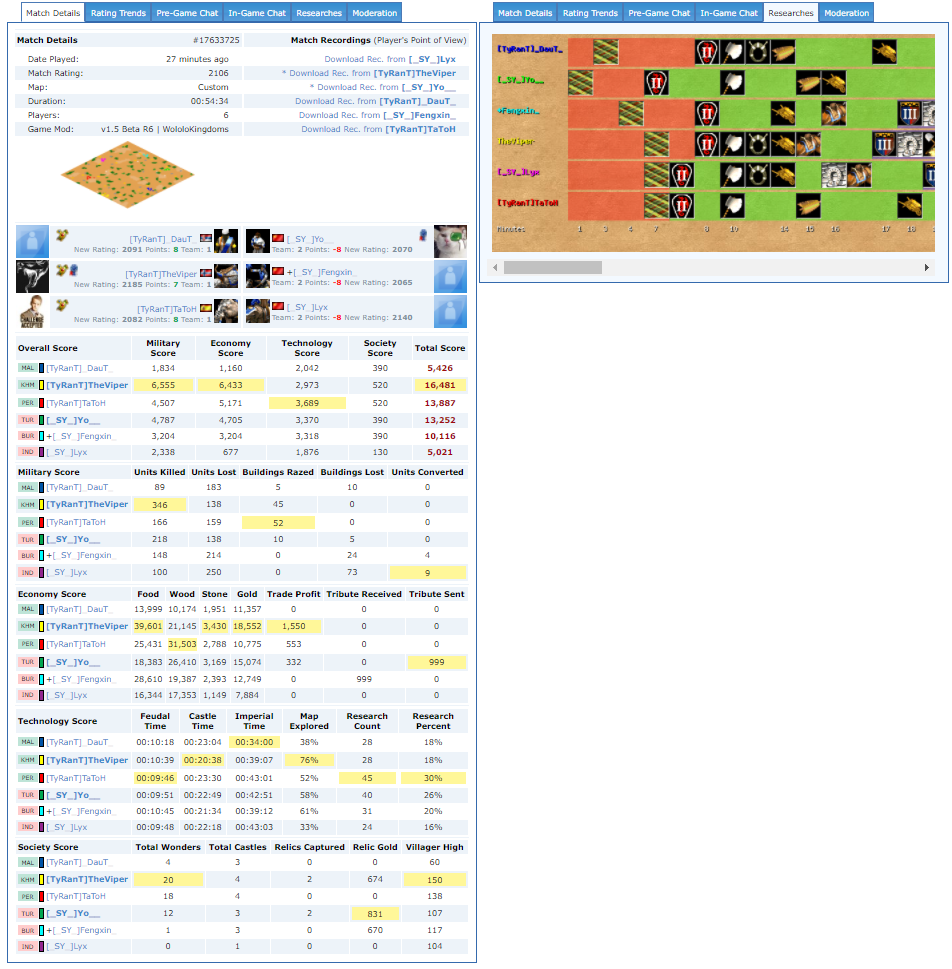
This is already a great source of info, and various community members have used such information to analyze games and player performance, though for our setting, it might not be enough. Post-game summaries are relatively worthless in our setting, as our goal is not to build a predictive model that can predict who won given a final state of affairs (that would be extremely easy), but to also done so given a current game state, gathered as the game progresses.
Sadly, Voobly does not provide data at this level of granularity, at least not directly. Luckily, it does allow an option to download “recorded games”, small files containing a completely playback of a match which you can replay using the game itself.
Using a simple web scraping script written in Python, I hence collected a bunch of games from Voobly, together with their according recordings, leaving us with a database full of match information as well as a directory full of recordings (2619 matches):
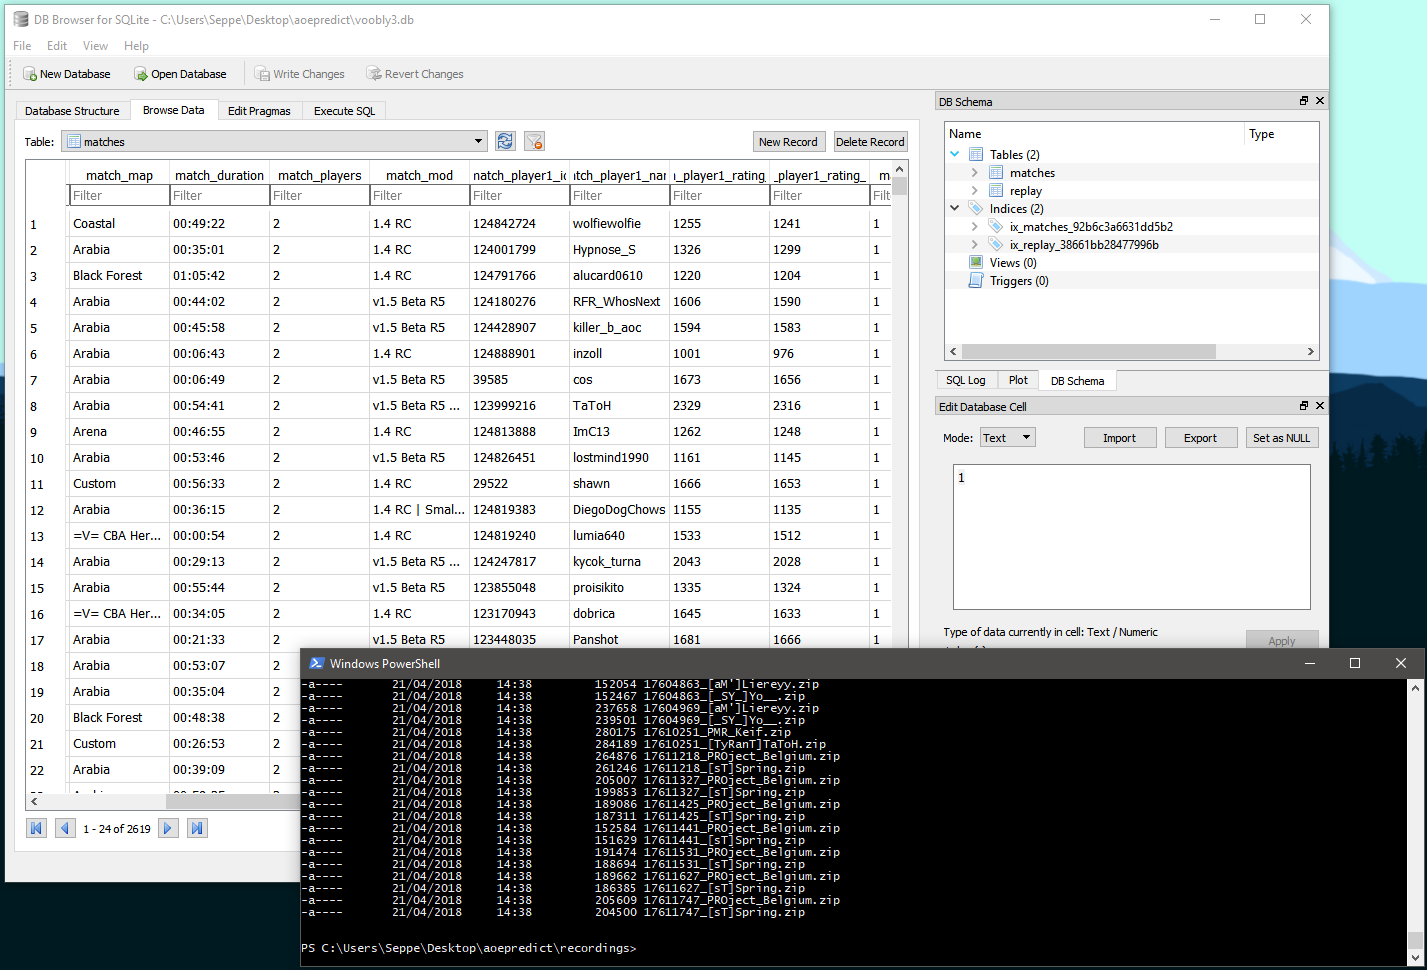
What I wanted to do next is to go through each game step by step, extracting a game state every few seconds or so. To do so, my first idea was to attempt parsing the recordings to extract this information. The “MGZ” binary file format which stores these is pretty well known and reverse engineered, with lots of projects and documents being available:
- https://github.com/happyleavesaoc/aoc-mgz
- https://github.com/stefan-kolb/aoc-mgx-format
- https://github.com/goto-bus-stop/recage
- https://github.com/goto-bus-stop/recanalyst
- https://web.archive.org/web/20090215065209/http://members.at.infoseek.co.jp/aocai/mgx_format.html
However, as I was going through these resources, it quickly become clear that this wasn’t going to be as easy as initially thought. The first issue for recAnalyst outlines the problem:
I scanned through documentation and some code, but I don’t see anything to read the actual game play information instead of just stats and initial points.
With the answer:
Rec game bodies consist of a series of commands. This has all the gameplay stuff in it so you could parse it out if you know what all the commands mean. Biegleux put a few parsers in there (the building creation, unit creation, and research ones), but I don’t know about the others.
The idea of recorded games basically boils down to a file format containing the initial starting state for each player. Then, the game itself is simply stored as a sequence of player commands (move this object here, queue this unit in this building, make this unit attack this unit, and so on), without there being intermediate “key frames” we could extract. As such, to reconstruct a game’s state at a certain time point, we’d have to basically replay all commands up until that time point to recreate the state at that point.
This is not to be unexpected for a 1999 game. And many of these decisions have to do with the underlaying network synchronization model (see this fantastic article describing the setup, for instance), though it does lead to a problem. The only reliable “player” for the recordings is the game engine itself. As a reliable recreation can only be done if you know the exact aspects of the simulation (e.g. to parse a “move this unit” command, you’d have to know the speed of the unit, how terrain affects the path, and so on), the only program that can reliably do this is the game. At this point, I’d had to pick between one of the following solutions:
- Parse the recordings using aog-mgz to extract the information we can per time stamp. Based on the commands contained in the recordings, we can for instance figure out when a certain research was started, which units were created, and which buildings were put down. This allows us to aggregate some state over time (e.g. at time point t, player 1 has created 20 villagers), though we miss out on a lot of details exactly describing the current state. Knowing for instance how much of those units or buildings were killed off is extremely hard to extract. This is also why most AOEII community sites basically show the same information: research as performed over time (as shown on the Voobly matchpages) is relatively easy to parse out, but a detailed evolution of units alive is much harder. Though we can imagine this information to be useful to a predictive model (a player creating units at a faster rate should have an edge regardless of how many of these were killed off, generally speaking), I wasn’t convinced about this approach.
- The second approach entails replaying each recording through the game. As we’ve noted above, Voobly is able to overlay dashboards which do show information about the game as-is and do take into account a current count of units being alive, for instance. So if we can get this information out every second or so as the game progresses, we would have the data we need.
I opted to go for the second approach, but also here, the game and tooling around it shows its age and complexity. First of all, the main dashboard overlay for Voobly does not contain a simply option to stream data out over a socket. Not to worry, as I could just rapidly build a mod myself which would be able to do so. However, finding reliable information on building such a mod (without having deep ties with Voobly, I assume), this is virtually impossible to do. Voobly exposes an internal spectator API (presumably based on reading out important stats from the game’s memory as it is running), though does not provide any documentation, guides, or whatsoever for one to build such a mod themselves.
Being stuck on this route, I briefly considered taking periodic screenshots of the game and using OCR to convert statistics to a structured data set, before deciding that this would probably be extremely error prone. However, it occurred to me that although most streamers use the “Spectator Overlay” mod to overlay statistics, there is also an alternative, “Spectator Dashboard“, which does allow to stream out information whilst running, for example to include it in a custom OBS video overlay. However, at the time of writing, the mod was incompatible with Wololokingdoms, which the majority of competitive games are using.
Whilst I was thinking about this, my last resort was a forum post on AOCZone, to see if I’d maybe missed a particular tool or approach. To my delight, HappyLeaves, (the Spectator Dashboard author self) was willing to point out a few things. First, the Voobly spectator API indeed does seem to be surrounded by an air of mystery. Second, HappyLeaves provided my with an updated build which is able to pump its statistics through a websocket and did work with WololoKingdoms. Big thanks to HappyLeaves! It would be great if Voobly would open up this API for outside authors or some information would be open sourced, though I assume the main driver preventing this is that it would probably lead to using it to create cheating tools as well.
At this point, I had a bunch of recordings, the game and Voobly installed, and a mod which pumped out statistics at a rapid pace over a websocket. The only thing remaining now is to replay those recordings one by one, right? However, this too, turns out to be easier said then done. It turns out that MGZ recordings, since they’re so tied to the game engine, will not work reliably in cases where the game engine does not completely match with the game engine that produced the file. For instance, trying to replay a recording produced by a player running UserPatch version 1.4 will simply crash the game if you start it with the UserPatch version 1.5 enabled. Sadly, the MGZ format does not contain a metadata section containing this information, though the Voobly match pages do list which configuration was used, so this information was available based on what I’d scraped earlier. In hindsight, it would probably have been easier to limit myself to a known single configuration (latest UserPatch at the time of gathering with WololoKingdoms), but nevertheless the issue remained how this whole approach could be automated. In general, parsing a recording boils down to the following steps:
- Move the recordings file to the correct directory (depending on the mod selected, Voobly will look in different locations)
- Open a Voobly game
- Open its settings window, make sure the right patch and mod are selected
- In another part of the settings window, indicate you want to watch a recording
- Launch the game
- Speed up the game and read all the data from the websocket
- Close the game, and move to the next file
This would have been relatively easy if Voobly contained some sort of command line utility where you’d simply be able to execute:
watch_recording.exe /patch "UserPatch 1.4" /mod "WololoKingdoms" /rec "my_recording.mgz" /speed 99
I Googled around for a while, but was unable to find such command line interface. It doesn’t seem that Voobly stores game settings in the Windows registry either, so the only approach remaining was to write a Python script full of horrible win32api calls and GUI automation tooling to go over these steps that way. Voobly doesn’t use standard Windows components (I believe it uses Qt), so many clicks and checks were written simply by taking a screenshot and checking the pixel color at a certain position (to make sure the “Watch recording” checkbox was enabled, for instance). The same goes for the game itself: upon starting it, I simulate some mouse presses to the “speed up” button. In the background, a second Python process is started which starts reading the websocket and dumps the retrieved data to a database table. Once data has stopped arriving, the process closes itself, and the automation script knows it should close the game, at which point the next recording can be set up.
AOEII does not allow to speed up games beyond a speed of “99”, and together with frequent random crashes, I often had to go in and rescue the script by closing the game manually and restarting it. I often stopped parsing recordings for a few weeks due to being busy (and December holidays), so overall it took more than three months before I’d gone through all the recordings.
Finally, we could use this data to build a predictive model.
Building the Model
I decided to go with R for the model building step, since I prefer its dplyr and tidyr libraries a bit more compared to, say, Pandas to perform data wrangling.
A first bunch of lines loads in the table containing the replay information, with one line per (match, timestamp) combo. I only retain information for the first two players, as I’m only considering 1v1 matchups here.
library(DBI)
library(RSQLite)
library(dplyr)
library(tidyr)
library(dbplyr)
library(rlang)
library(glue)
library(ggplot2)
options(scipen=999)

# ================
# Data preparation
# ================

con <- dbConnect(SQLite(), dbname="voobly3.db")
dbListTables(con)

db.matches <- tbl(con, "matches")
db.replay <- tbl(con, "replay")

db.replay %>% colnames

replay_table <- db.replay %>%
filter(type=='tick') %>%
select(match_id, current_time,
        starts_with("data_players_0_"),
        starts_with("data_players_1_"))
All columns in this table come from the stats plugin running in the game and contain about 150 features per timestamp, such as:
[5] "data_players_0_units_infantry"   "data_players_0_units_ranged"
[7] "data_players_0_units_siege"      "data_players_0_units_war_ships"
[9] "data_players_0_units_cavalry_archers"  "data_players_0_units_cavalry"
[11] "data_players_0_units_monks"     "data_players_0_units_idle_fishing_ships"
[13] "data_players_0_units_stone_miners"    "data_players_0_units_gold_miners"
Giving this kind of information to any predictive model will make it kind of hard for it to figure out what is influencing the outcome of the game. Instead, we first perform a pairwise transformation, simply by taking the difference between pairs of columns relating to the same info for both players. Instead of saying that player 0 has 14 gold miners and player 1 has 16 is pretty hard for a predictive model to make sense of directly, so instead we create one column a saying that the difference between player 0 versus player 1 is -2. (A similar approach is taken in this blog post which is pretty interesting to go through.)
Caveat: the above is of course up for discussion, as one could argue that the difference of 14 goldminers versus 16 encodes something else than the difference of 100 goldminers versus 102, even though it would result in the same delta value in our approach. Perhaps the difference of two goldminers is important in the lower number range, but less meaningful in the higher number range, and we’d lose this information after applying our suggested transformation. This is a valid remark but one we will ignore for now.
To create the difference columns in R, we need to perform some heavy juggling (hard-coding all columns is possible too, but less fun):
grepgsub <- function(l, pattern="^data_players_\\d+_(.*)$") {
    grepped <- grep(pattern, l)
    subbed <- gsub(pattern, "\\1", l[grepped])
    result <- as.list(unique(subbed))
    return(result)
}

diff_expression <- function(l, pattern="^data_players_\\d+_(.*)$",
  expression="(data_players_0_{x} - data_players_1_{x})", prefix="diff") {
    name_list <- grepgsub(l, pattern=pattern)
    expr_list <- name_list %>%
        lapply(function(x) parse_quosure(glue(expression))) %>%
        setNames(paste(prefix, name_list, sep = "_"))
    return(expr_list)
}

# Calculate diff statistics:
# - First deal with kills and razes (as this is a pairwise column in itself)
# - We recode these to a single column per player since we take 1v1 games only
# - Then mutate for difference calculation
# - Then bring in names and make match id and time numeric
# - Then remove original columns

diff_table <- replay_table %>%
mutate(data_players_0_kills=data_players_0_kills_2,
        data_players_0_razes=data_players_0_razes_2,
        data_players_1_kills=data_players_1_kills_1,
        data_players_1_razes=data_players_1_razes_1) %>%
select(-contains('kills_'), -contains('razes_')) %>%
mutate(player_1_name=data_players_0_name, player_2_name=data_players_1_name) %>%
mutate(!!!diff_expression(colnames(.))) %>%
mutate(match_id=as.numeric(match_id), current_time=as.numeric(current_time)) %>%
select(-starts_with('data_players_'), -diff_id, -diff_name)
We can validate this by taking a look at a single match:
library(cowplot)

plot_grid(
diff_table %>% filter(match_id==16720619) %>%
    select(current_time, diff_population_total) %>%
    collect %>%
    ggplot(aes(x=current_time, y=diff_population_total)) +
    geom_line() + geom_hline(yintercept=0) + xlab("") + ylab("Pop Diff"),
replay_table %>% filter(match_id==16720619) %>%
    select(current_time, data_players_0_population_total, data_players_1_population_total) %>%
    collect %>% gather("type", "population_total", 2:3) %>%
    ggplot(aes(x=as.numeric(as.character(current_time)),
            y=as.numeric(as.character(population_total)),
            colour=type, group=type)) +
    geom_line(show.legend=F) + xlab("Game Time") + ylab("Total Pop"),
ncol=1
)
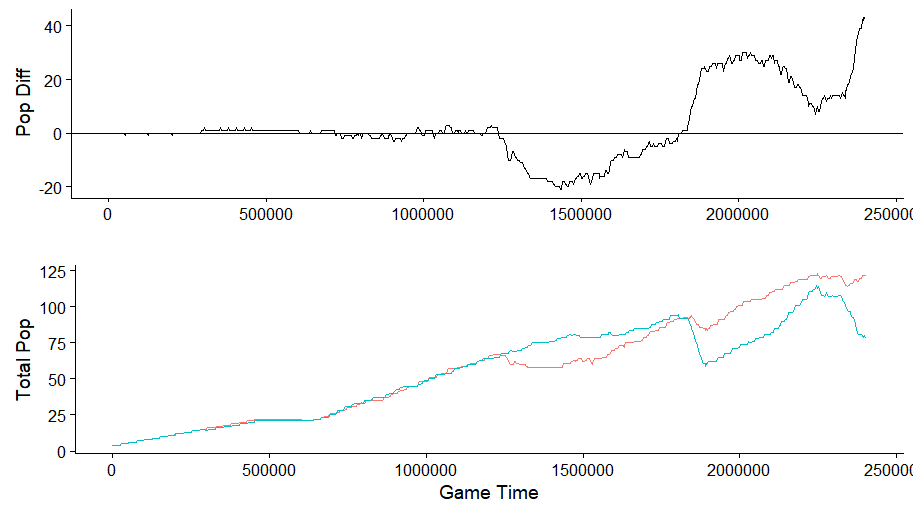
This works. The final step is to bring in the target information, which we’re going to binary encode (i.e. we’ll create a player_1_wins column set to 1 if player 1 won, and to 0 if player 2 won). This is a bit annoying as the replay data lists the names of both players, though they might not be in the same order as what we have collected in our match metadata, from which we also want to bring in a final difference feature: the difference between the ELO ratings of the players before starting the match. To make things a bit worse, the player names extracted from Voobly often include a clan tag at the beginning, whereas the ingame names might not.
extra_info <- db.replay %>%
left_join(db.matches, by='match_id') %>%
select(match_id, match_winner,
        data_players_0_name, data_players_1_name,
        match_player1_name, match_player2_name,
        match_player1_rating_before, match_player2_rating_before) %>%
distinct %>% collect %>%
mutate(winner_name=ifelse(match_winner==1, match_player1_name, match_player2_name)) %>%
mutate(player_1_wins=as.numeric(endsWith(data_players_0_name, winner_name))) %>%
mutate(order_normal=endsWith(data_players_0_name, match_player1_name)) %>%
mutate(diff_rating=ifelse(order_normal,
                            match_player1_rating_before-match_player2_rating_before,
                            match_player2_rating_before-match_player1_rating_before)) %>%
select(match_id, winner_name, player_1_wins, diff_rating) %>%
distinct
We check whether this worked based on some spot checks:
> db.matches %>% filter(match_id == 16720619) %>% collect %>% select(match_winner, contains("name"))
# A tibble: 1 x 3
match_winner match_player1_name match_player2_name
        <int> <chr>              <chr>
1            1 TrunicC            chagass

> extra_info %>% filter(match_id == 16720619)
# A tibble: 1 x 4
match_id winner_name player_1_wins diff_rating
    <int> <chr>               <dbl>       <int>
1 16720619 TrunicC                1.          80

> diff_table %>% filter(match_id == 16720619) %>% select(contains("name"))
# Source:   lazy query [?? x 2]
# Database: sqlite 3.11.1 [C:\Users\Seppe\Desktop\aoepredict\voobly3.db]
player_1_name player_2_name
<chr>         <chr>
1 [CiD]TrunicC  [ VkA_]chagass
2 [CiD]TrunicC  [ VkA_]chagass
3 [CiD]TrunicC  [ VkA_]chagass
4 [CiD]TrunicC  [ VkA_]chagass
5 [CiD]TrunicC  [ VkA_]chagass
6 [CiD]TrunicC  [ VkA_]chagass
7 [CiD]TrunicC  [ VkA_]chagass
8 [CiD]TrunicC  [ VkA_]chagass
9 [CiD]TrunicC  [ VkA_]chagass
10 [CiD]TrunicC  [ VkA_]chagass
# ... with more rows
We can now bring everything together into a final table and are ready to model. Since we have a lot of data (every match exposes hundreds of snapshots), we’ll use a sample to train our model. We also want to create a balanced sample to make sure we have a 50-50 outcome of player 1 or player 2 winning. Finally, we also make sure to set aside a test set from this sample:
library(caret)

sample <- final_table %>% group_by(player_1_wins) %>% sample_n(size = 30000) %>% as.data.frame
sample$player_1_wins %>% table

partition <- createDataPartition(sample$player_1_wins)

sample.train <- sample[partition$Resample1,]
sample.test <- sample[-partition$Resample1,]
Additionally, there is another trick we can apply here to make the models themselves more robust. Since all our features are differences, we can regard every instance where player 1 won also as an instance where player 2 won simply by flipping the sign of every column (if player 1 is two villagers ahead of player 2, then player 2 is two villagers behind). Doing so nicely smooths out our sample and prevents our model being biased towards a particular direction below or above zero for features. It’s unlikely to matter very much given the amount of data we’re going to push in, but nevertheless a good approach:
mirror_data <- function(ds, prefix='diff_', target='player_1_wins') {
ds.m <- ds %>%
    mutate_at(vars(starts_with(prefix)), (function(x) -x)) %>%
    mutate_at(vars(target), (function(x) factor(abs( as.numeric(levels(x))[x] - 1))))
return(bind_rows(ds, ds.m))
}

# Only apply this on the train set

sample.train <- mirror_data(sample.train)
We only apply this on the training data, however. The part kept aside as the test set is untouched:
> sample.train$player_1_wins %>% table
    0     1
30000 30000

> sample.test$player_1_wins %>% table
    0     1
15000 15000
As a baseline model, we can see how logistic regression fares:
model.glm <- glm(player_1_wins ~ ., family=binomial(link='logit'),
                data=sample.train %>% select(-match_id, -current_time))
Which obtains:
Confusion Matrix and Statistics on TRAIN

        Reference
Prediction     0     1
        0 21431  8569
        1  8569 21431

            Accuracy : 0.7144

Confusion Matrix and Statistics on TEST

        Reference
Prediction     0     1
        0 10759  4255
        1  4241 10745

            Accuracy : 0.7168
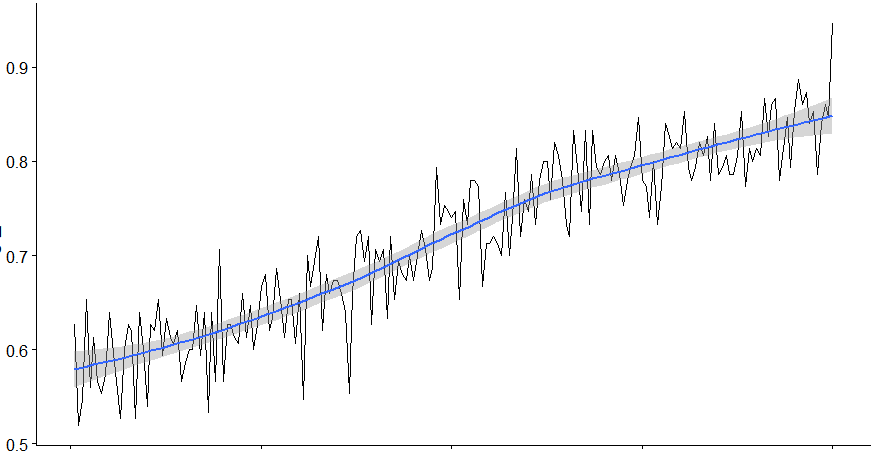
This is not too bad, especially since our data also includes snapshots which occur right after a game has started. We’d hence expect our accuracy to improve as games progress, which is indeed the case:
Nevertheless, we can try to do better, so let’s also construct a random forest model:
library(randomForest)

model.rf <- randomForest(player_1_wins ~ .,
                data=sample.train %>% select(-match_id, -current_time),
                ntree=300, importance=T)
Here, the results are much better: 99% accuracy on the train set, and 83% accuracy on the test set. Since this looks like a solid improvement, I decide to continue with this model.
A final check on the complete data set (without retraining the model) obtains the same accuracy and confirms that our model is indeed able to generalize its predictions:
Confusion Matrix and Statistics

        Reference
Prediction      0      1
        0 755618 136151
        1 153962 762804

            Accuracy : 0.8396
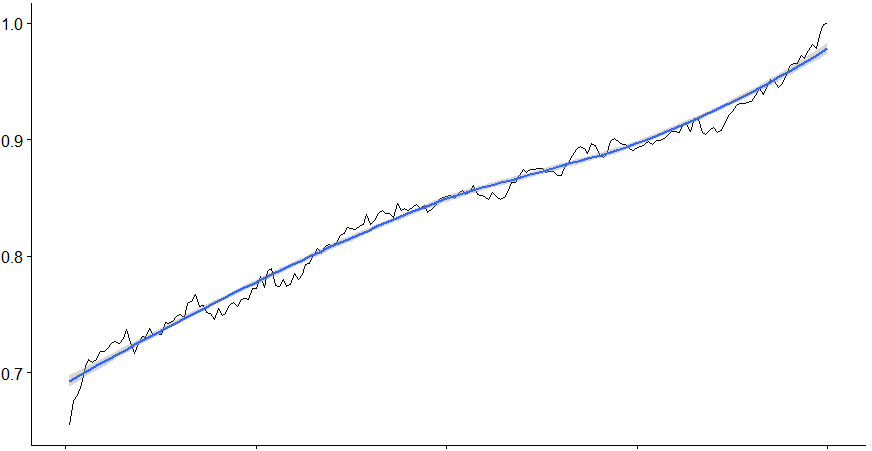
With the accuracy through time looking like this:
Inspecting the Results
We can now look inside our predictive model a bit further to see what drives the outcome of a match, a simple variable importance ranking is obtained simply as follows:
imp <- importance(model.rf, type=1, scale = F)
ggplot(data.frame(imp=imp[,1], var=names(imp[,1])) %>% filter(imp>=0.01), aes(x=var, y=imp)) +
    geom_bar(stat='identity') +
    coord_flip()
This pretty much confirms what we expected already:
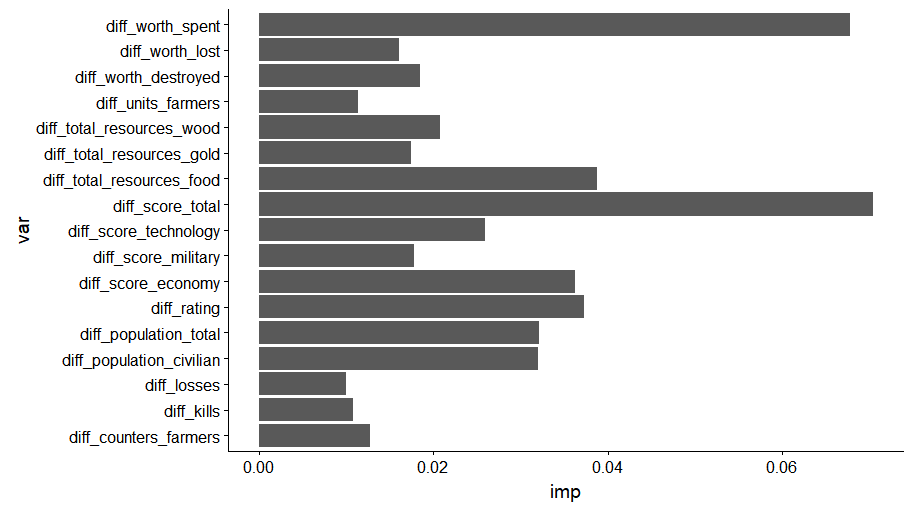
First of all, the score actually seems to provide a solid representation of how far ahead a player is. Next to this, the resources spent play an important role as well, together with resources (with food being more important), population counts, and the ELO rating. The latter is pretty expected, as we’ll see later that this is pretty much the only meaningful variable at the beginning of matches, as all other delta statistics will be close to zero, and the higher ranking player generally ends up winning the match.
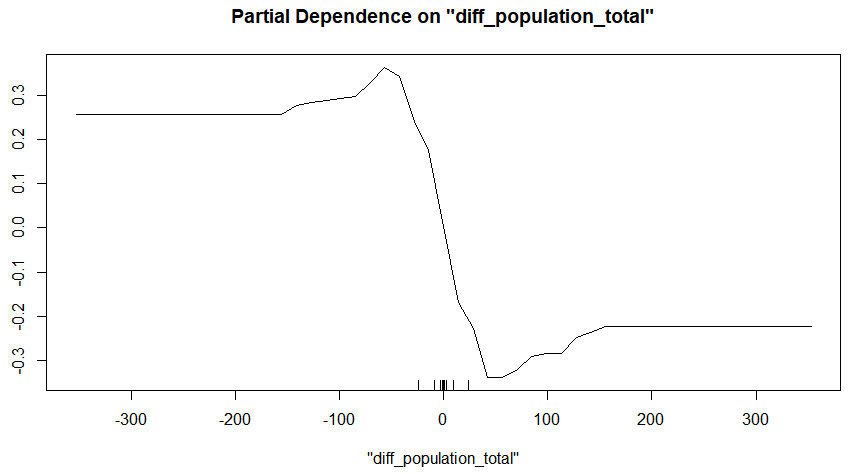
Taking a look at the partial depence plots for the total score and total population count basically reflects the same insight:
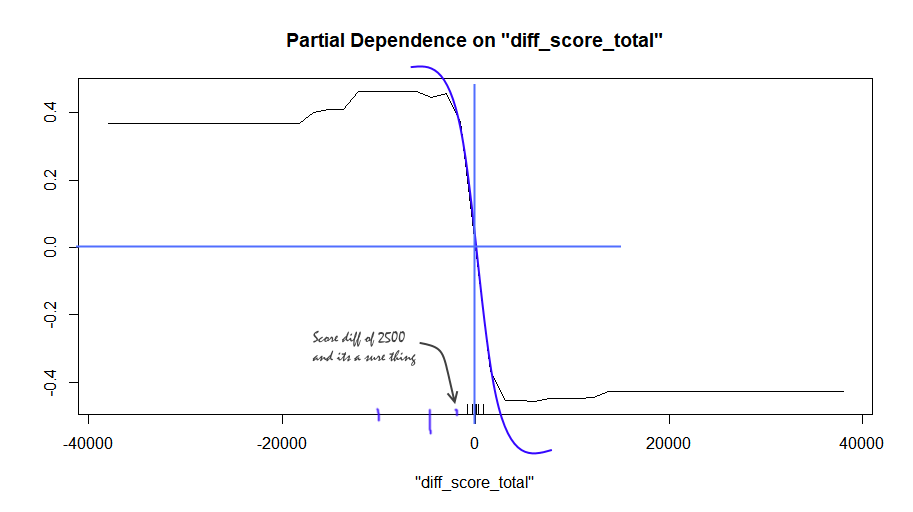
The score has a direct influence on the outcome, and plateaus off after a difference of 2500 has been reached, as not many games carry on beyond this. Generally speaking a score difference of >1000 is already a strong sign in favor of the respective player.
For the total population difference, the results are similar:
Let’s take a look at some matches to see what happened and what our model thinks of them.
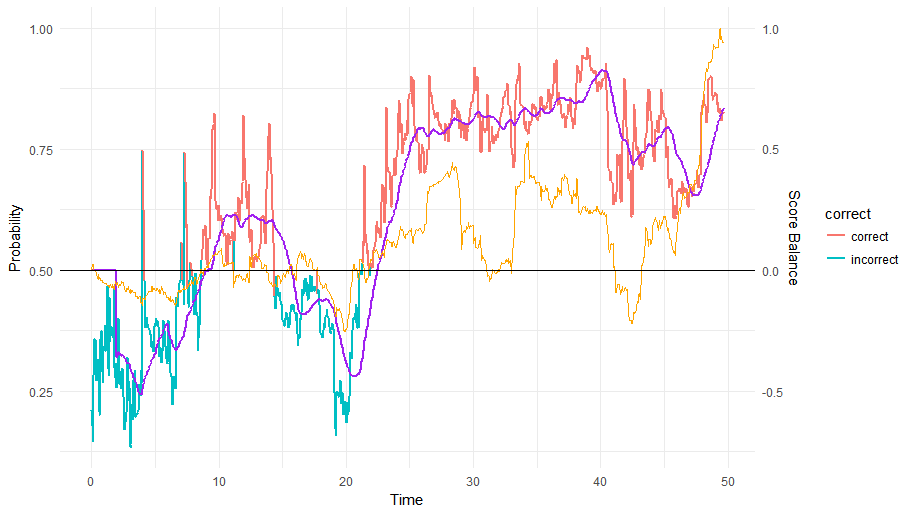
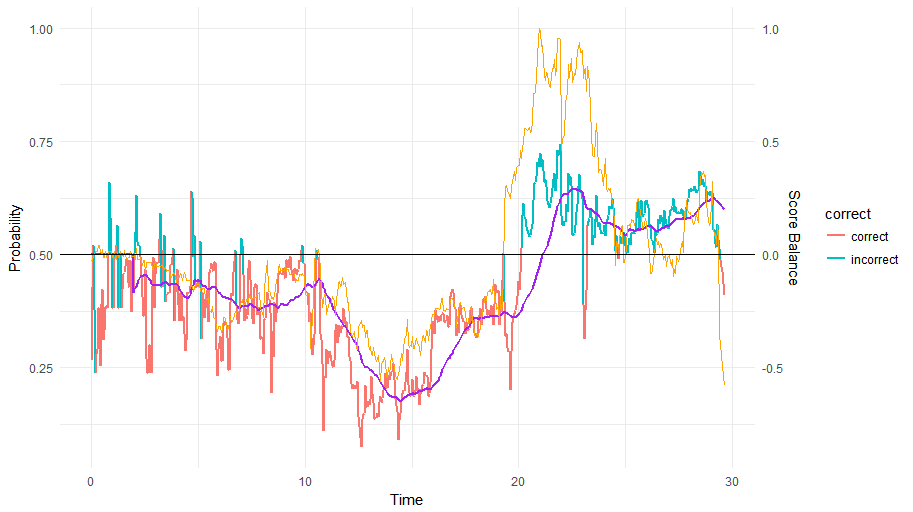
The blue/red colored line shows the output of our model through time, with the purple line showing a moving average over the last 40 ticks (every minute leads to more or less 20 game ticks, so this is a moving average over about two minutes). The orange line plots the score difference over time, scaled so that the highest score difference is represented as (+/-)1. This is already an interesting use case: our prediction varies wildly (as does tehe score) up until minute 20, from which point onwards our model remains sure until the end about player 1 winning. Interestingly enough, the score still jumps up and down (even in favor of the other player around the 40th minute mark).
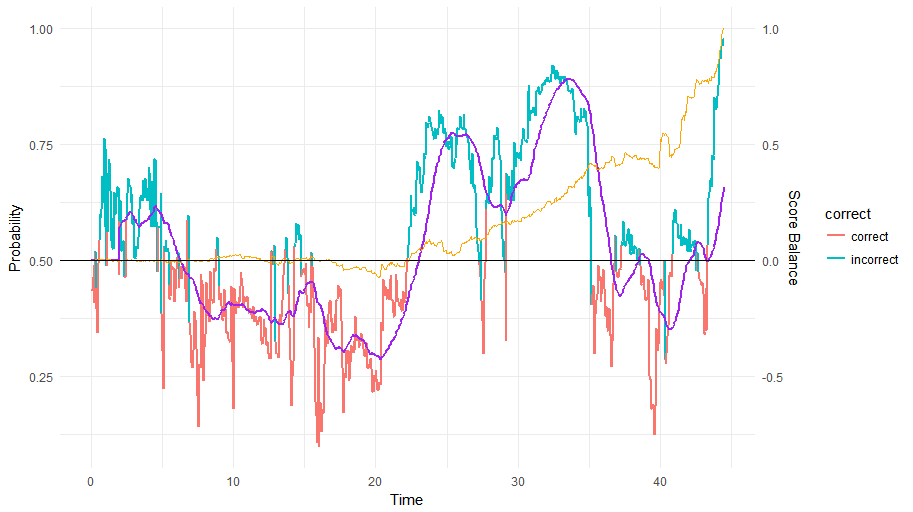
The following match draws a stranger picture:
Here, our model is confused up until the 20 minute mark before deciding that player 1 has the upper hand, as is also reflected in the score. Strangely enough, only at the very end does the score (and our prediction) plummet with the second player actually winning. So this is definitely a difficult case to predict!
In fact, it might be a good idea to inspect what the accuracy of our model is in terms of predicting the very last game state (i.e. right before someone resigns). We’d expect this to be extremely close to 100%:
Confusion Matrix and Statistics

        Reference
Prediction    0    1
        0 1039   53
        1   78 1064

            Accuracy : 0.9414
Almost, but not quite. This was a bit worrying at the time, so I decide to investigate a few matches where our model remains wrong until the very last moment. In many of them, it simply turns out to be “re”-games where players decided to cancel to match after a few minutes of play. It would have been a good idea to filter those out, though since they don’t really influence the model’s accuracy as a whole, we don’t need to worry much about these. The following match, however, was strange (match id 16721231):
Nothing makes sense here: the game goes up and down between the players, sure, and it seems that our model even heavily disagrees with the score in this case, which steadily goes up in favor of the first player. Nevertheless, a few minutes until the end, our model (and the score) are very sure about themselves and almost reaches a probability of 1. However, note that the color indicates that this turned out to be the incorrect prediction, as it is not player 1 but 2 which won this game.
At first, I suspected an error with the player name matching procedure, so I verified the outcome on the Voobly page, showing the same thing. In the end, I ended up going through the recording myself from start to finish. Indeed, it’s a very close game until the very last minute or so, with player 2 calling “gg” first. However, it is then player 1 which quits out the game by pressing resign first, causing the wrong player to be attributed the win on Voobly. So this is clearly a noisy data issue which we can safely ignore as well. After a few further checks, the accuracy of 94% above isn’t as troublesome any longer.
At this stage, there were two things I wanted to explore further:
- “Sure, anyone can predict the outcome right before a game ends”, so how long would it take for the model to call the outcome. We can represent this as the probability staying above or under 0.50 at taking the ratio of the point of time when this happened to the total game time. Or otherwise: “how quickly in terms of how long was played could we have called the game?”
- “Everyone can predict the outcome when looking at the score, rating, villager count and total population”, or put differently, I wanted to quantify how much better this model would be compared to the gut feeling of a regular game viewer who typically consider a few key measures. One could even argue based on some of the matches we’ve seen above that a model using score alone might be enough…
In order to answer these questions, I construct a second model only using the score, rating, total population and villager population features. This models obtained a 79% accuracy level, so we’re still doing a bit better overall using the additional information. What we would really like however, is the answer to the first question: how much faster can we call the outcome?
To do so, I compare the predictions over time per match for the regular model and the simple model. I also construct “smoothed” versions of those two models by averaging the probability over the past 40 game ticks (about two minutes) as the plots before had shown that this often works well to smooth out irregular jumps in the probability. For each match, I look at the earliest point in time the probability stays above or below the cutoff of 0.50 and divide that by the total running time to get a ratio. The lower this ratio, the earlier we can “close in” on the match outcome. Plotted as density curves, we get the following result:
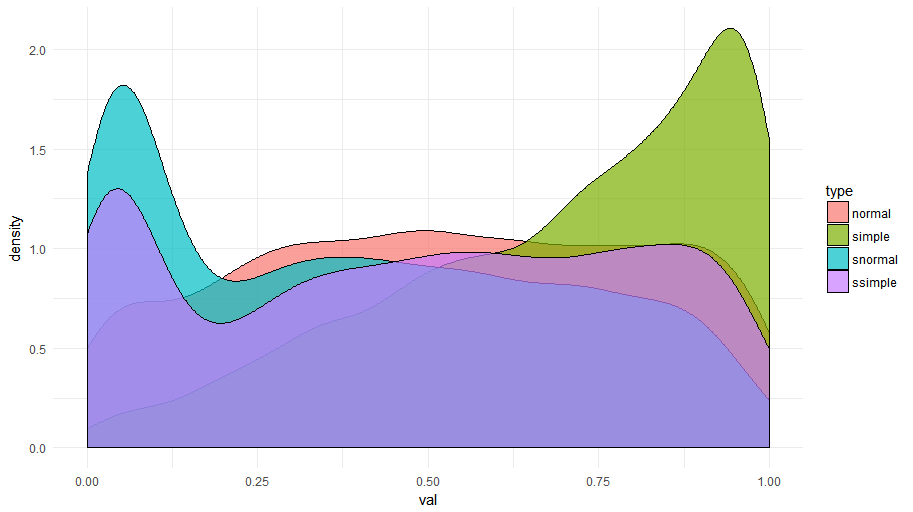
This is a fantastic result. Especially when smoothing out the predictions over time a bit (“snormal” and “ssimple”), a massive amount of matches are already “decided” before they’re half underway. For the non smoother versions (“normal” and “simple”), it takes a bit longer before the model can be sure, but here we note the huge benefit of using all the features we have at our disposal versus only using the ones in our simple model, with the “normal” curve being sure of itself much earlier in the match. In fact, this is what we saw in the first match timeline shown above, where the score, for instance, still jumped up and down a bit whereas the model had already decided on its final preference.
Deployment
As a final step, I wanted to see this model running at least in some form on a live match. A few lines of R code exposes our model as an API:
save(model.rf, file="model.rda")

# Deploy as API

library(plumber)
r <- plumb("model_api.R")
r$run(port=8000)
With “model_api.R” basically containing a predict call together with pre-processing steps to convert an instance as retrieved from the websocket to the difference columns we want.
By modifying our Python websocket reader a bit, we can make a call to this API:
r = requests.post('http://localhost:8000/predict', json={"instance": flattened})
And show the result whilst the game is running:
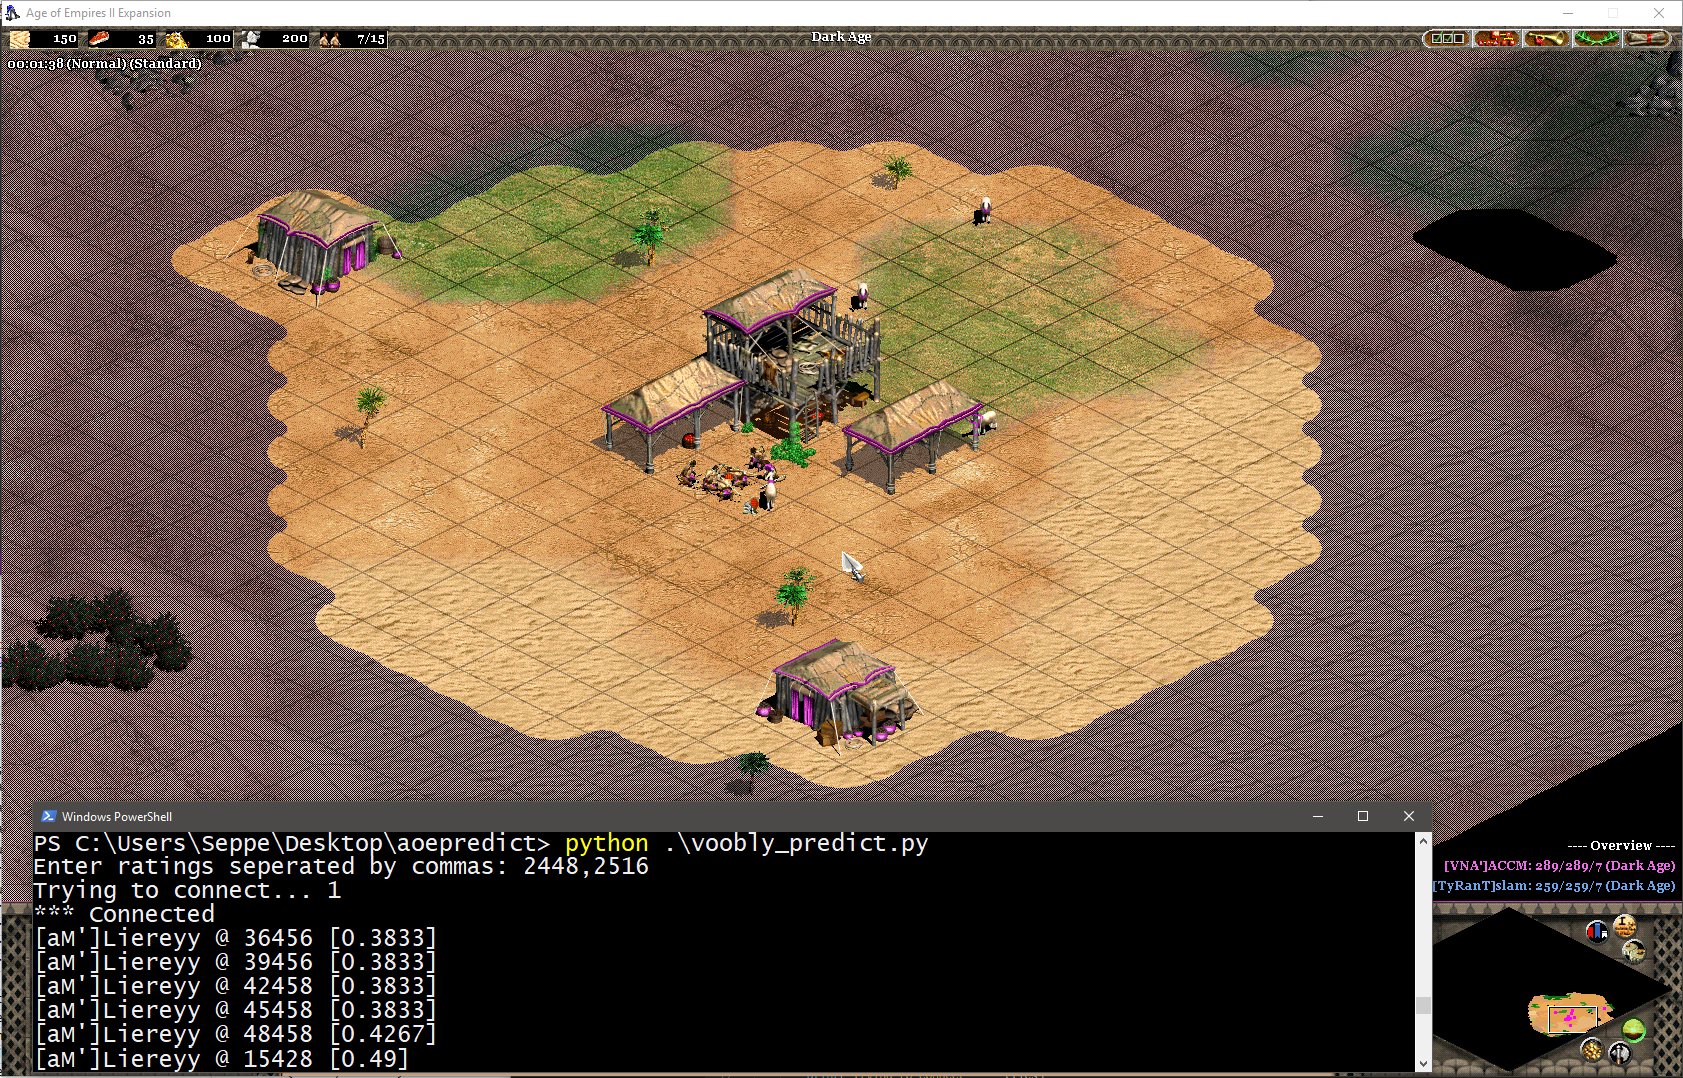
This actually illustrates pretty well how the model is user the rating information. At the beginning of the game, this is the only thing the model can go with until more detailed information becomes available.
Conclusion
This weekend data science project turned out to take a bit longer than just one weekend. Funnily enough, the modelling step turned out to be extremely easy, without missing values or other typical annoying issues to deal with. That said, there are still a number of possibilities for further expansion:
- The current information being exposed by the spectator plugin does not include research information, especially ages the players are in. This is widely known to be important as well, so this might still be useful to parse out manually from the recordings
- The current time is dropped as a feature, but might be useful to nevertheless include somehow. Perhaps there are interaction effects present based on how long the game has been running for. E.g. the villager count is important in the beginning of games, but maybe less so towards the end. Including ages will also partially capture this
- We take simple differences between stats, but as explained above, this abstracts away from some information
- Civilizations are not included as a feature at the moment. I simply forgot to scrape out this information from the Voobly pages, but it might be wortwhile to see if it makes a difference
- Currently, we simply predict per snapshot, and have seen how smoothing out the predictions over a period of time helps their overall usefulness. To incorporate this in the model itself, and reduce some of the irregular jumps a bit, it might be useful to add in trend features as well by deriving these from the n snapshots before the one being predicted on
- It would still be useful to construct a very simple model using only a handful of features. This might increase the general “deployability” of the model. In addition, it would still be interesting to see whether using extracted information from existing MGZ recorded game parsers would actually turn out to be sufficient to obtain an acceptable accuracy level
- Speaking of deployability: I’m not one to “spend 80% of time getting the final 20% of the work finished up,” so I’m not really thinking about building a beautiful moving trendline kind of overlay for OBS, even although I’d love to see a predictive component being used in e-sports casting similar as is being done on poker channels, for instance
In any case, this has been a very fun time killer to work on. I plan to make all the full scripts and data available on GitHub at some point in time soon (even regarding their horrible form), though will spend some time to only incorporate the training sample instead of the full database (which is way too big with 2GB of data to put online), as well as changing the scraper to incorporate civilizations.
Update: the code, model and data are now available on this GitHub repository (warning: not the most clean setup you’ll ever see). The Voobly scraper has been modified to download civ information. The data set itself has been converted to a csv.gz file to save on size.